remotes::install_github("Bureau-for-Economic-Research/berdata")API
R
berdata

![]()

The berdata library is a basic wrapper around the Data Playground Portal API from BER maintained by the Bureau for Economic Research.
This is the homepage for the {berdata} R package https://github.com/Bureau-for-Economic-Research/berdata.
NOTE: The API is currently in BETA testing.
This package was developed at the Bureau for Economic Research in order to streamline research processes and allow automation for its internal research.
About BER
The Bureau for Economic Research (BER) is one of the oldest economic research institutes in South Africa. It was established in 1944 and is part of the Faculty of Economic and Management Sciences (EMS) at Stellenbosch University. Over the years, the BER has built a local and international reputation for independent, objective and authoritative economic research and forecasting.
Installation
Install from GitHub.
Usage
library(berdata)Check version.
packageVersion("berdata")[1] '0.1.0'Set API Key
To access the API you’ll need to first specify an API in your .Renviron key as provided to you by BER. (usethis::edit_r_environ())
.Renviron
BERDATA_API=place_your_key_hereAfter setting the API key in .Renviron, remember to restart R: ctrl + shift + F10.
- In R
Sys.setenv(BERDATA_API = "place_your_key_here")
Sys.getenv("BERDATA_API")
[1] "place_your_key_here"The API interface
The package provides an interface to the BER data API. The function get_data has the following options:
time_series_codetime series code to return,KBP7096Boutput_formatoutput format to return
library(berdata)
library(logger)

get_data(time_series_code = "KBP7096B",
         output_format = "codes") %>%
   tidyr::drop_na()
# A tibble: 770 × 2
date_col KBP7096B
<date> <dbl>
1 1960-01-01 5.5
2 1960-02-01 4.6
3 1960-03-01 3.3
4 1960-04-01 2.5
5 1960-05-01 1.2
6 1960-06-01 0.4
7 1960-07-01 1.2
8 1960-08-01 2.5
9 1960-09-01 2.1
10 1960-10-01 2.5
# ℹ 760 more rowsIf you want to turn on the logging:
library(berdata)
library(logger)

log_threshold(level = DEBUG)
get_data(time_series_code = c("KBP7096B","KBP7008Q", "KBP7203M"),
         output_format = "codes") %>%
  tidyr::drop_na()
# A tibble: 598 × 4
date_col KBP7096B KBP7203M KBP7008Q
<date> <dbl> <dbl> <dbl>
1 1974-05-01 1.2 76 6.1
2 1974-06-01 1 67 6.1
3 1974-07-01 0.5 58 4.5
4 1974-08-01 0.5 49 4.5
5 1974-09-01 -0.2 47.7 4.5
6 1974-10-01 -1.6 46.3 1.9
7 1974-11-01 -3.3 45 1.9
8 1974-12-01 -4.4 44 1.9
9 1975-01-01 -4.7 43 10
10 1975-02-01 -5.2 42 10
# ℹ 588 more rowsDifferent Formats
Codes
library(berdata)

get_data(time_series_code = c("KBP7096B","KBP7008Q", "KBP7203M"),
         output_format = "codes") %>%
  tidyr::drop_na()
# A tibble: 598 × 4
date_col KBP7203M KBP7008Q KBP7096B
<date> <dbl> <dbl> <dbl>
1 1974-05-01 76 6.1 1.2
2 1974-06-01 67 6.1 1
3 1974-07-01 58 4.5 0.5
4 1974-08-01 49 4.5 0.5
5 1974-09-01 47.7 4.5 -0.2
6 1974-10-01 46.3 1.9 -1.6
7 1974-11-01 45 1.9 -3.3
8 1974-12-01 44 1.9 -4.4
9 1975-01-01 43 10 -4.7
10 1975-02-01 42 10 -5.2
# ℹ 588 more rowsNames
library(berdata)

get_data(time_series_code = c("KBP7096B","KBP7008Q", "KBP7203M"),
         output_format = "names") %>%
  tidyr::drop_na()
# A tibble: 598 × 4
date BER: Constraints on current manufacturing…¹ Coincident indicator…²
<date> <dbl> <dbl>
1 1974-05-01 76 1.2
2 1974-06-01 67 1
3 1974-07-01 58 0.5
4 1974-08-01 49 0.5
5 1974-09-01 47.7 -0.2
6 1974-10-01 46.3 -1.6
7 1974-11-01 45 -3.3
8 1974-12-01 44 -4.4
9 1975-01-01 43 -4.7
10 1975-02-01 42 -5.2
# ℹ 588 more rows
# ℹ abbreviated names:
# ¹`BER: Constraints on current manufacturing activities: shortage of raw materials`,
# ²`Coincident indicator of the US`
# ℹ 1 more variable: `Total employment in the private sector` <dbl>Nested
library(berdata)

get_data(time_series_code = c("KBP7096B","KBP7008Q", "KBP7203M"),
         output_format = "nested")
# A tibble: 3 × 11
source country name frequency frequency_description classification
<chr> <chr> <chr> <chr> <chr> <chr>
1 SARB ZA quaterly_bullet… monthly Monthly Business cycl…
2 SARB ZA quaterly_bullet… quaterly Quarterly Business cycl…
3 SARB ZA quaterly_bullet… quaterly Monthly Business cycl…
# ℹ 5 more variables: description <chr>, timeseries_code <chr>,
# unit_of_measure <chr>, unit_of_measure_description <chr>, data <list>Plotting series
── Attaching core tidyverse packages ──────────────────────── tidyverse 2.0.0 ──
✔ dplyr     1.1.2     ✔ readr     2.1.4
✔ forcats   1.0.0     ✔ stringr   1.5.0
✔ ggplot2   3.4.4     ✔ tibble    3.2.1
✔ lubridate 1.9.2     ✔ tidyr     1.3.0
✔ purrr     1.0.2
── Conflicts ────────────────────────────────────────── tidyverse_conflicts() ──
✖ dplyr::filter() masks stats::filter()
✖ dplyr::lag()    masks stats::lag()
ℹ Use the conflicted package (<http://conflicted.r-lib.org/>) to force all conflicts to become errorslibrary(tidyverse)
library(bertheme)
library(berdata)
get_data(time_series_code = c("P7162-N-VALSEAS-RAILPJOUR"),
output_format = "codes") %>%
ggplot(., aes(x = date_col, y = `P7162-N-VALSEAS-RAILPJOUR`, color = "P7162-N-VALSEAS-RAILPJOUR")) +
geom_line(linewidth = 1.25) +
scale_y_continuous(labels = scales::comma) +
scale_color_ber() +
labs(
title = "Passenger journeys for rail passenger transportation",
subtitle = "Thousands ('000) Actual values",
y = "",
x = ""
) +
theme_ber(base_size = 15, title_size = 16,
subtitle_size = 15,
subtitle_color = "#595959") +
guides(color ="none")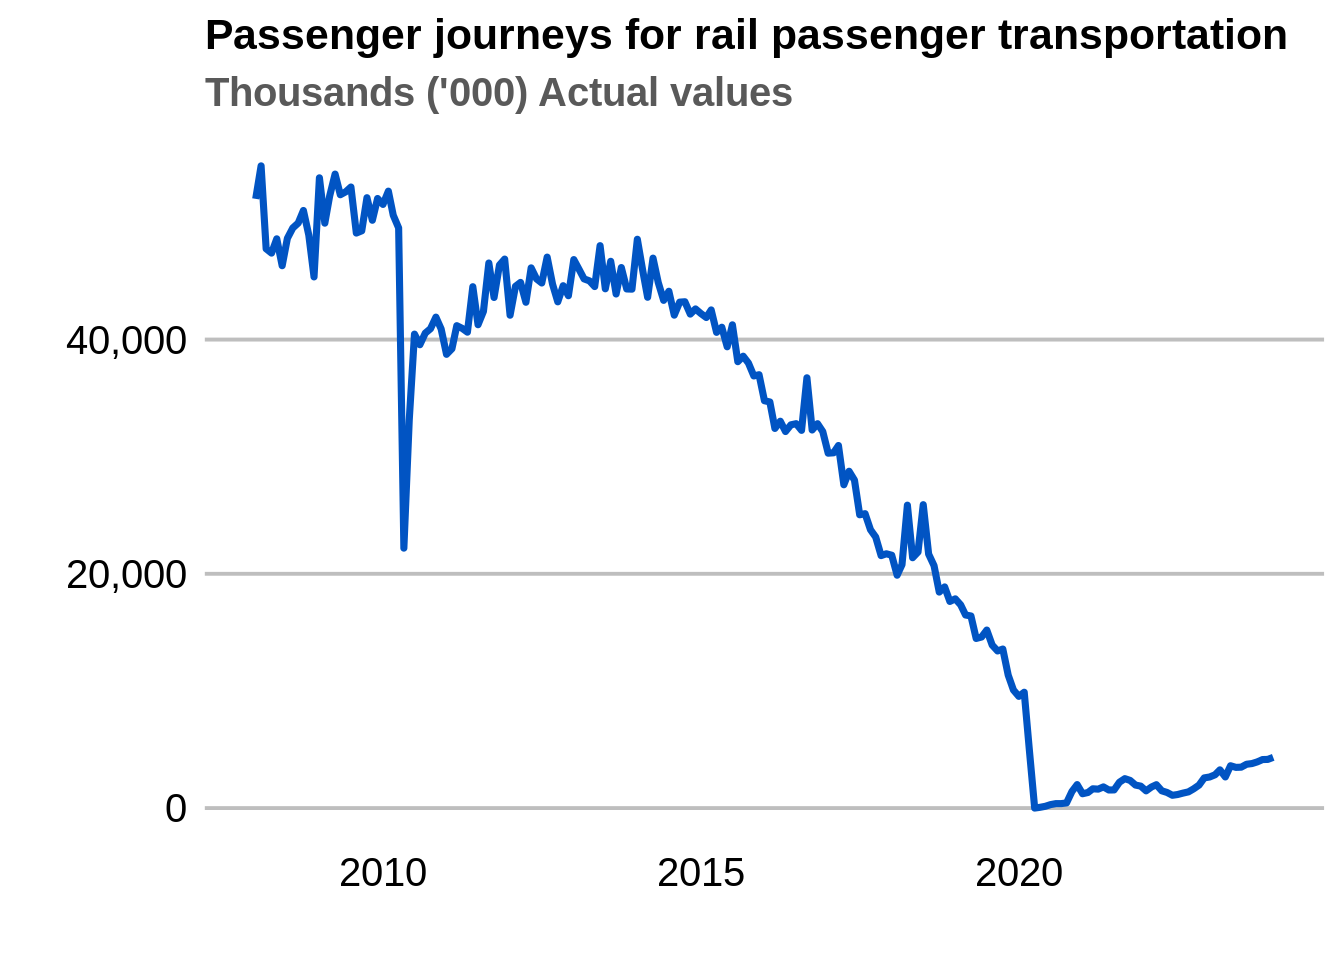
library(tidyverse)
library(bertheme)
library(berdata)

get_data(time_series_code = c("P4141-ELEKTR23", "P4141-ELEKTR24"),
         output_format = "nested") %>%
  select(description, data) %>%
  unnest %>%
  filter(date_col > "2015-01-01") %>%
  ggplot(., aes(x = date_col, y = value, color = description)) +
  geom_line(linewidth = 1.25) +
  scale_y_continuous(labels = scales::comma) +
  scale_color_ber() +
  labs(
    title = "Electricity generated and available for distribution",
    subtitle = "Gigawatt-Hours",
    y = "",
    x = ""
  ) +
  theme_ber(base_size = 15, title_size = 16,
                          subtitle_size = 15,
                          subtitle_color = "#595959")  +
  guides(color = guide_legend(nrow = 2,
                              byrow = TRUE))
Warning: `cols` is now required when using `unnest()`.
ℹ Please use `cols = c(data)`.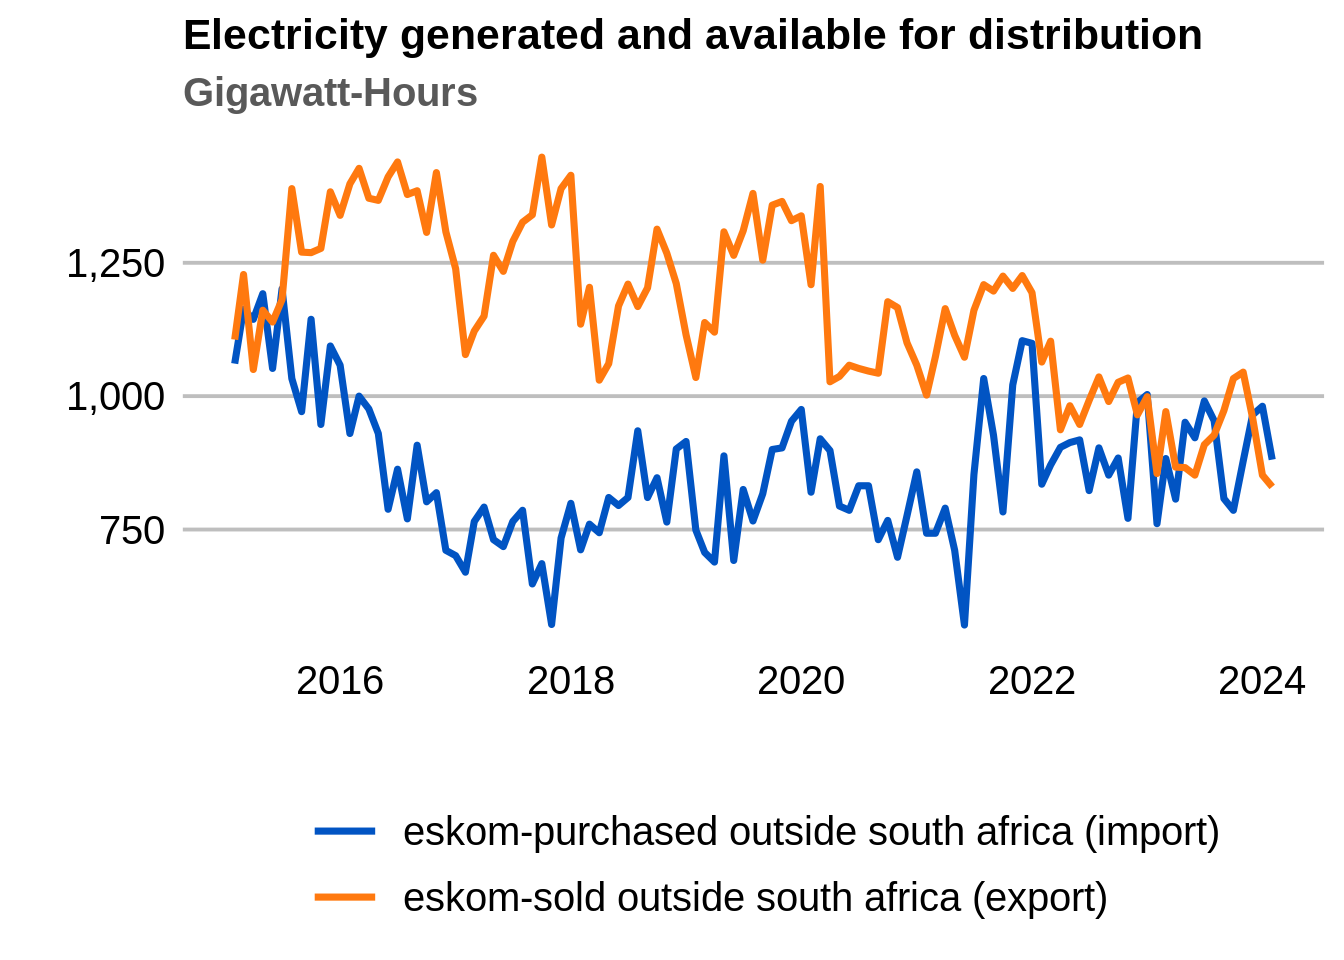
Python
pyberdata
![]()
The pyberdata library is a basic wrapper around the Data Playground Portal API from BER maintained by the Bureau for Economic Research.
This is the homepage for the {pyberdata} python package https://github.com/Bureau-for-Economic-Research/pyberdata. If you are looking for the R version, it can be found here: {berdata} R package https://github.com/Bureau-for-Economic-Research/berdata.
NOTE: The API is currently in BETA testing.
Disclaimer
This package was developed at the Bureau for Economic Research in order to streamline research processes and allow automation for its internal research.
About BER
The Bureau for Economic Research (BER) is one of the oldest economic research institutes in South Africa. It was established in 1944 and is part of the Faculty of Economic and Management Sciences (EMS) at Stellenbosch University. Over the years, the BER has built a local and international reputation for independent, objective and authoritative economic research and forecasting.
Create an environment
mkdir ~/venv && cd ~/venv
python3 -m venv pyberdata
source ~/venv/pyberdata/bin/activate
Installation from Github
Clone the repo from Github:
pip install git+https://github.com/Bureau-for-Economic-Research/pyberdataUsage
Set API Key
To access the API you’ll need to first specify an API key in your .env key as provided to you by BER.
.env
BERDATA_API=place_your_key_hereAfter setting the API key in .env
- In python
from decouple import config

print(config("BERDATA_API"))place_your_key_hereThe API interface
The package currently provides an interface to the Data Playground Portal API. The package is designed around the BERClient class. The attributes are:
apikey- Specify the API provided to you by the BER
The main method get_data has the following options:
time_series_codetime series code to return:KBP7096Boutput_format- Should output be a nested
{polars}data frame,{dict}or{json}
- Should output be a nested
import logging
from decouple import config
from pyberdata import BERClient
from pkg_resources import get_distribution


def setup_logger():
    # create logger
    logger = logging.getLogger("pyberdata")
    logger.setLevel(logging.DEBUG)
    # logger.setLevel(logging.INFO)

    # create console handler and set level to debug
    ch = logging.StreamHandler()
    ch.setLevel(logging.DEBUG)

    # create formatter
    formatter = logging.Formatter("%(asctime)s [%(levelname)s] %(name)s: %(message)s")

    # add formatter to ch
    ch.setFormatter(formatter)

    # add ch to logger
    logger.addHandler(ch)


def main():
    setup_logger()
    print(get_distribution("pyberdata").version)

    client = BERClient(apikey = config("BERDATA_API"))
    client = BERClient(apikey = "test")

    time_series_code = ["KBP7096B", "KBP7008Q", "KBP7203M"]
    out = client.get_data(time_series_code, output_format = "codes")
    out = client.get_data(time_series_code, output_format = "names")

    # Experimental
    out = client.get_data(time_series_code, output_format = "nested")

    return out


if __name__ == "__main__" and __package__ is None:
    print(f"Main name is {__name__}")
    main()
shape: (3, 12)
| Source | Country | Name | Frequency | Frequency description | Classification | Description | Timeseries code | Unit of measure | Unit of measure description | date_col | value |
|---|---|---|---|---|---|---|---|---|---|---|---|
| str | str | str | str | str | str | str | str | str | str | list[str] | list[str] |
| "SARB" | "ZA" | "quaterly_bulletin" | "quaterly" | "Monthly" | "Business cycle and labour anal… | "Coincident indicator of the US" | "KBP7096B" | "PERC" | "12-Term % change" | ["1922-01-01", "1922-02-01", … "2024-02-01"] | ["NA", "NA", … "1.7"] |
| "SARB" | "ZA" | "quaterly_bulletin" | "monthly" | "Monthly" | "Business cycle and labour anal… | "BER: Constraints on current ma… | "KBP7203M" | "NA" | "NA" | ["1922-01-01", "1922-02-01", … "2024-02-01"] | ["NA", "NA", … "58"] |
| "SARB" | "ZA" | "quaterly_bulletin" | "quaterly" | "Quarterly" | "Business cycle and labour anal… | "Total employment in the privat… | "KBP7008Q" | "PERC" | "Seasonally adjusted at annual … | ["1922-01-01", "1922-02-01", … "2024-02-01"] | ["NA", "NA", … "-0.6"] |